Drilling
Drill down - and up - to display information at different levels of detail. For example, a user could click a year in a report to view data for each quarter of the year, and click the quarter to see data for each month in the quarter.
There are different ways that drilling is enabled for reports:
- A Visualizer user can create one or more drill paths for a particular report (see Report level drill paths).
- A Space Administrator can create drill paths and drill maps for use across the whole space.
- A Space Administrator can create a hierarchy in the dimensional model of the space.
- The pre-configured time attributes are already set up for drilling.
Visualizer displays a Drill icon to indicate that an attribute in the Chart Builder can be drilled to show a different level of detail.
Tips:
- Drill-down is not supported for pie charts.
- If you plan to include a Visualizer chart report in a new dashboard, be aware that a drill-across at the dashboard dashlet level overrides a drill-down defined at the chart report level.
Drill in Visualizer
Add a measure and an attribute configured for drilling.
- Click
the drill icon. Visualizer shows the next level attribute in the Subject
Area.
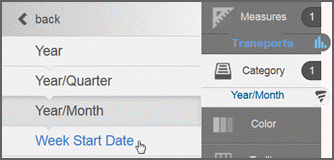
- Click
on the drilldown attributes in the Subject Area to swap out the attributes
in Chart Builder. Visualizer will keep showing the next level down until
the last attribute is reached.
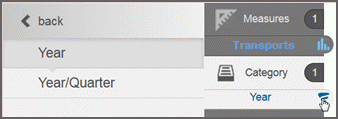
- To interact with the drillable chart, click on a chart component to start the drill -down. For example, click a year column to see the chart change from year to year/quarter.
- Keep clicking on the chart to continue drilling. You can click a breadcrumb to go back to a previous view.
- Click Save.
- Add the report to the dashboard by clicking Save & Insert.
Report level drill paths
When the dashboard or space-level drill paths are not exactly what you want, you can create one or more custom drill paths for the report. A drill path is normally associated with an attribute, so if you show multiple attributes then you can have multiple drill paths.
Each report-level drill path must be unique and attributes cannot appear in more than one drill path in the same report.
Drilling behavior follows this hierarchy:
- Dashboard-level drill-across links.
- Report-level drill paths as described in this topic.
- Space-level drill paths.
- Drill maps defined at the space level.
- Hierarchies in the dimensional model of the space.
- Built-in Time series drill paths.
As users click through drill paths, the nodes display across the top of reports.
Drill paths create filters that apply across a dashboard. When a user clicks to activate a drill path in the dashboard, the filter card for that drill node appears.
For table reports, drill paths and hyperlinks are underlined in blue. Also, in some browsers, hovering over a hyperlink can display the link path in the browser.
Create a report-level drill path
- From the edit mode on a report, click Advanced Tools > Report - Level Drilling.
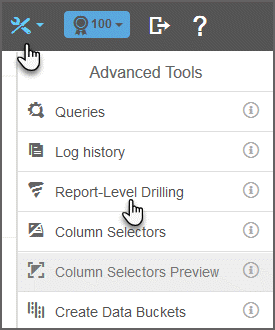
- In the Report-Level
Drilling window, click Add Drill Path.

- Name
the new path.
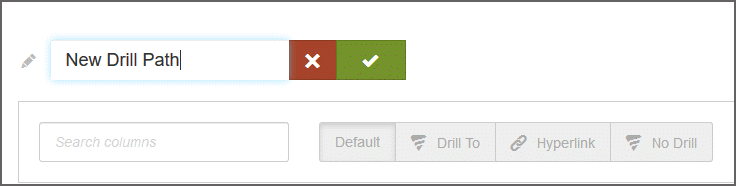
- In the new
drill path panel, click the field
and select the first attribute.
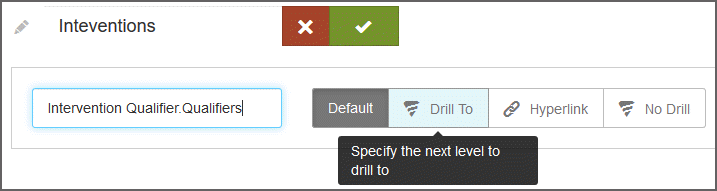
- Click Drill To.
- Click the field and select the second attribute.
- Select Hyperlink.
- Enter the URL using BQL syntax. Surround the URL in single quotes.
- Select whether to open the URL in a new window or in the same window as the report.
- Click Done.
- Click Save.
Disable drilling
- In the Report-Level Drilling window, click Add.
- Name the new drill path.
- In the new drill path panel, select the attribute you want to disable.
- Click No Drill.
- Click Done.
- Click Save.